Setting Up an Elasticsearch Cluster with Kibana, Filebeat, and Metricbeat on AWS (CentOS 7)
Introduction
Hey folks, Welcome back :) In this blog post, I will walk you through the detailed process of setting up an Elasticsearch Cluster along with Kibana, Filebeat and Metricbeat on AWS EC2 instances running CentOS 7. We will cover everything from server deployment, VPC Setup, Firewall rules, cluster Configuration and dashboard access. In the next phase of this blog, i will automate all the below steps with the help of Terraform Script. So lets get start..
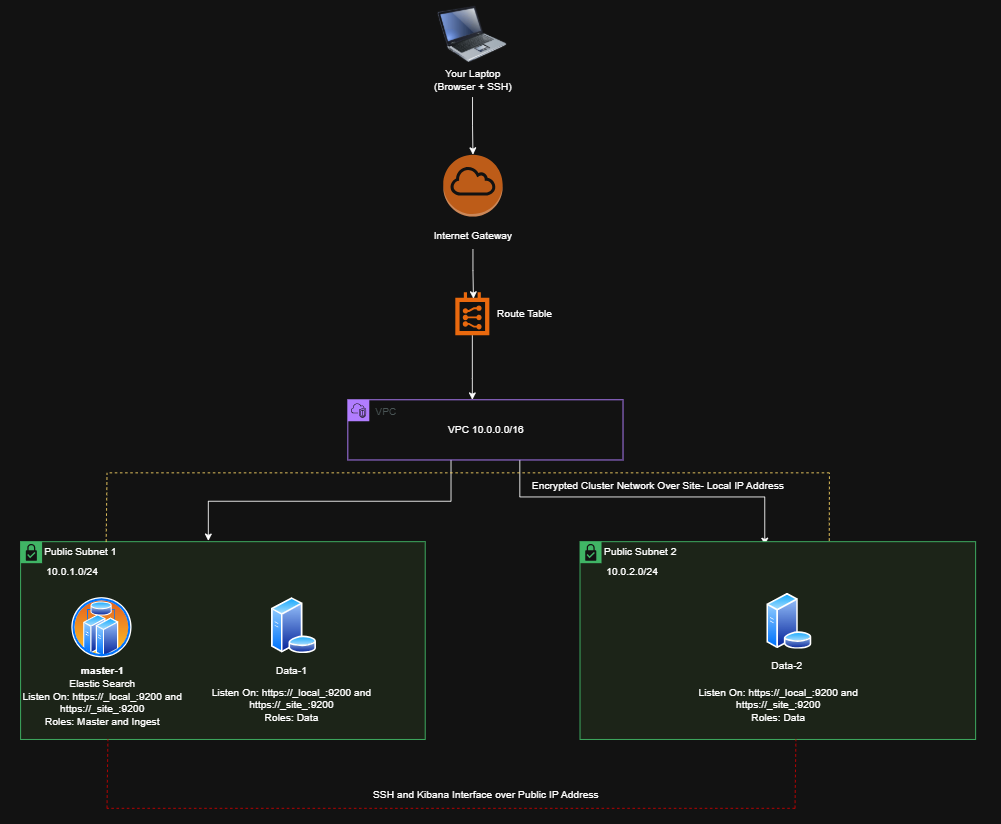
Architecture Layout Setup
| Subnet | CIDR | Instances | Notes |
|---|---|---|---|
| Public Subnet 1 | 10.0.1.0/24 | master-1, data-1 | 1st AZ (e.g., us-east-1a) |
| Public Subnet 2 | 10.0.2.0/24 | data-2 | 2nd AZ (e.g., us-east-1b) |
Instances and Services
| Instance | Role | Services Installed | |
| — | — | — | s |
| master-1 | Master Node | Elasticsearch Master, Kibana, Cert Authority | |
| data-1 | Data Node 1 | Elasticsearch Data Node | |
| data-2 | Data Node 2 | Elasticsearch Data Node |
Ports and Connections
| Port | Protocol | Purpose | Allowed From |
|---|---|---|---|
| 22 | TCP | SSH access | Your IP only |
| 9200-9300 | TCP | Elasticsearch cluster communication | Security Group |
| 8080 | TCP | Kibana Dashboard (custom port) | Anywhere or trusted IPs |
| 5601 | TCP | (Optional) Kibana default port | Anywhere or trusted IPs |
| ICMP | - | Ping (for troubleshooting) | Anywhere |
Security Groups Rules
- Inbound Connections:
- TCP 22 (SSH) from your IP
- TCP 9200 - 9300 between nodes (Master ↔ Data1 ↔ Data2)
- TCP 8080 open for Kibana Dashboard
- Outbound Connections:
- All All
How the will Communicate:
- Master-1 Node controls the cluster (elections, health, settings).
- Data-1 and Data-2 store the actual data and respond to queries.
- Kibana connects to master-1 Elastic Search node to fetch data and deploy in dashboard.
- Filebeat and Metricbeat ship logs and metrics to master node (Port 9200)
High Level Traffic Flow:
1
2
3
4
5
6
Your Laptop --> SSH --> Instances
Your Browser --> HTTP --> Kibana (port 8080)

Filebeat / Metricbeat --> Elasticsearch (port 9200)
Elasticsearch Nodes --> Communicate on 9200-9300
AWS Infrastructure Setup
1. Create VPC
- VPC CIDR:
10.0.0.0/16 - Subnets:
- Public Subnet 1:
10.0.1.0/24 - Public Subnet 2:
10.0.2.0/24
- Public Subnet 1:
- Internet Gateway: Attach to the VPC.
- Route Table: Create a route to the Internet Gateway and associate it with Public Subnets.
2. Create Security Group
- Allow:
- TCP 22 (SSH) from your IP
- TCP 9200-9300 (Elasticsearch communication)
- TCP 8080 (Kibana access)
- TCP 5601 (Optional: Kibana Default Port)
- ICMP (Ping)
3. Launch EC2 Instances
- AMI: CentOS 7 (Community AMI or custom if not available officially)
- Instance Type:
t3.medium - Instances:
master-1data-1data-2
- Assign them to Public Subnets.
- Use the security group created above.
For detailed step by step creation of EC2 Instance Creation Follow this Article Setting Up Metasploitable 2 with OpenVPN on AWS | 0xtmax
Server Level Firewall Configuration (Firewalld)
1
2
3
4
5
6
7
8
9
10
sudo yum install firewalld -y
sudo systemctl start firewalld
sudo systemctl enable firewalld

# Allow necessary ports
sudo firewall-cmd --zone=public --add-port=22/tcp --permanent
sudo firewall-cmd --zone=public --add-port=9200-9300/tcp --permanent
sudo firewall-cmd --zone=public --add-port=8080/tcp --permanent
sudo firewall-cmd --reload
Elastic Cluster Setup
- Initial Server Preparation
- SSH into each instance.
- Change the temporary passwords
- Add your user to sudoers if necessary.
1
2
 sudo su -
Install Elastic Search on All the Nodes:
1
2
3
4
5
6
7
8
9
10
11
12
 # Import GPG key
 rpm --import https://artifacts.elastic.co/GPG-KEY-elasticsearch

 # Download and install Elasticsearch RPM
 curl -O https://artifacts.elastic.co/downloads/elasticsearch/elasticsearch-7.6.0-x86_64.rpm
 rpm --install elasticsearch-7.6.0-x86_64.rpm

 # Enable Elasticsearch service
 sudo systemctl daemon-reload
 sudo systemctl enable elasticsearch.service

 #You install the lattest version
Elastic Search Configuration on master-1
Edit /etc/elasticsearch/elasticsearch.yml
1
2
3
4
5
6
7
8
9
10
11
cluster.name: playground
node.name: master-1
network.host: [_local_,_site_]
discovery.seed_hosts: ["172.31.115.14"]  # IP of master-1
cluster.initial_master_nodes: ["master-1"]

node.master: true
node.data: false
node.ingest: true
node.ml: false
on data-1 and data-2 Edit /etc/elasticsearch/elasticsearch.yml
1
2
3
4
5
6
7
8
9
10
11
cluster.name: playground
node.name: data-1 / data-2
network.host: [_local_,_site_]
discovery.seed_hosts: ["172.31.115.14"]  # IP of master-1
cluster.initial_master_nodes: ["master-1"]

node.master: false
node.data: true
node.ingest: false
node.ml: false
Configure the JVM Settings
Modify /etc/elasticsearch/jvm.options:
1
2
-Xms768m
-Xmx768m
- Start Elasticsearch
1
Sudo systemctl start elasticsearch
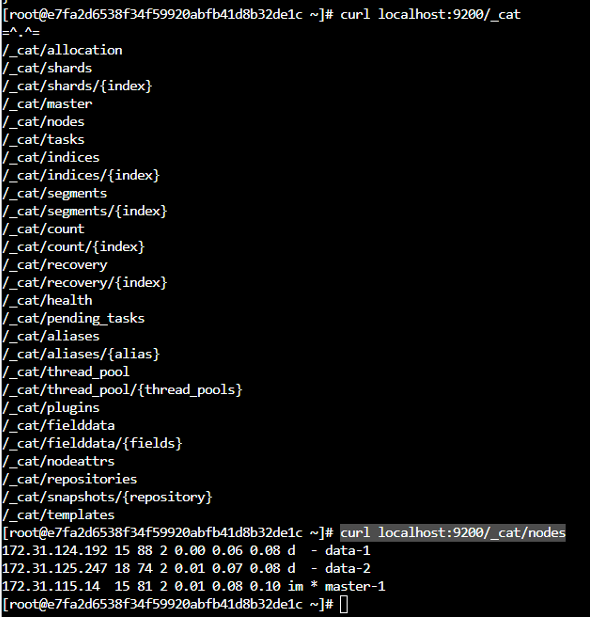
Verify using:
1
2
3
curl localhost:9200
curl localhost:9200/_cat/nodes?v
Encrypt the Cluster network - Enable SSL/TLS Security
Create Self-Signed Certificate on master-1:
1
2
3
4
5
6
7
 mkdir /etc/elasticsearch/certs
 /usr/share/elasticsearch/bin/elasticsearch-certutil cert --name playground --out /etc/elasticsearch/certs/playground

 # Change permission
 chown cloud_user:cloud_user /etc/elasticsearch/certs/playground
 chmod 640 /etc/elasticsearch/certs/playground
copy the certificate to data-1 and data-2
1
2
3
 scp /etc/elasticsearch/certs/playground cloud_user@<Data Node IP>:/tmp/
 sudo cp /tmp/playground /etc/elasticsearch/certs/
 sudo chmod 640 /etc/elasticsearch/certs/playground
Update Elasticsearch Security Settings in /etc/elasticsearch/elasticsearch.yml
1
2
3
4
5
 xpack.security.enabled: true
 xpack.security.transport.ssl.enabled: true
 xpack.security.transport.ssl.verification_mode: certificate
 xpack.security.transport.ssl.keystore.path: certs/playground
 xpack.security.transport.ssl.truststore.path: certs/playground
Restart the services:
1
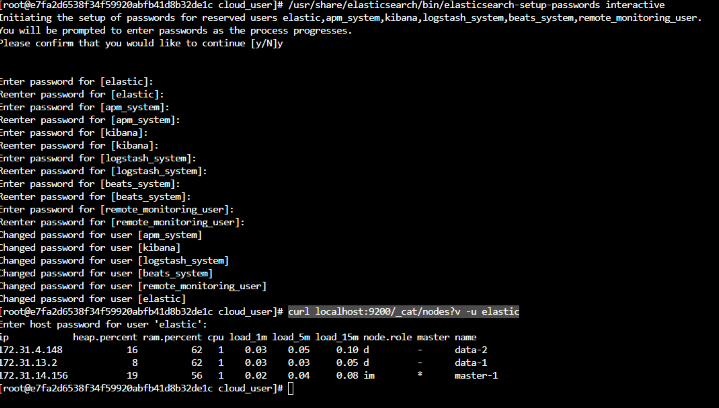
sudo systemctl restart elasticsearchSet/change the User passwords
1
2
 /usr/share/elasticsearch/bin/elasticsearch-setup-passwords interactive
Verify the authentication by:
1
 curl localhost:9200/_cat/nodes?v -u elastic
You can notice now, It will prompt for password:
Installing & Connecting Kibana to the ELK Cluster
Install Kibana
1
2
3
 curl -O https://artifacts.elastic.co/downloads/kibana/kibana-7.6.0-x86_64.rpm
 rpm --install kibana-7.6.0-x86_64.rpm
 sudo systemctl enable kibana
Configure Kibana by Editing /etc/kibana/kibana.yml
1
2
3
4
 server.port: 8080
 server.host: "172.31.115.14"  # IP of master-1
 elasticsearch.username: "kibana"
 elasticsearch.password: "<Your Kibana Password>"
Start the kibana
1
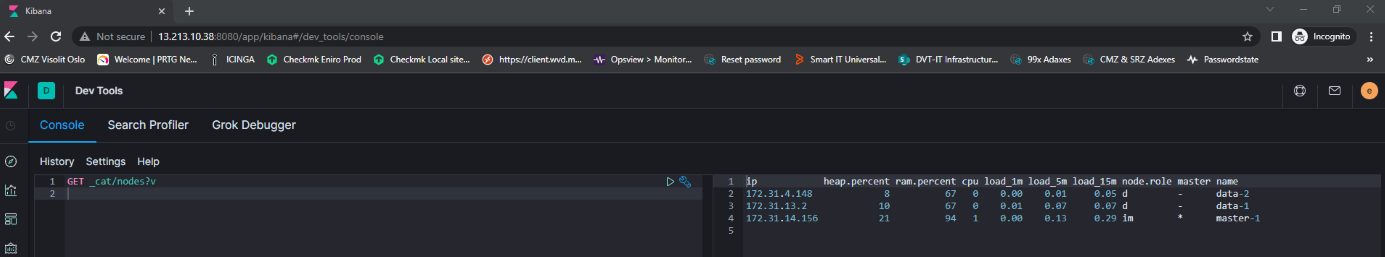
sudo systemctl start kibanaAccess Kibana from browser:
1
 http://172.31.115.14:8080 #IP of master-1
Login using the elastic user and then open Devtools in the menu and check the APIs.
Configuring Filebeat & Shipping Logs
Install Filebeat
1
2
3
 curl -O https://artifacts.elastic.co/downloads/beats/filebeat/filebeat-7.6.0-x86_64.rpm
 rpm --install filebeat-7.6.0-x86_64.rpm
 sudo systemctl enable filebeat
Configure Filebeat
Edit /etc/filebeat/filebeat.yml:
1
2
3
4
5
6
7
8
 setup.kibana:
   host: "172.31.115.14:8080"  # IP of master-1

 output.elasticsearch:
   hosts: ["172.31.115.14:9200"]  # IP of master-1
   username: "elastic"
   password: "<Elastic Password>"
Enable system module and start Filebeat:
1
2
3
 filebeat modules enable system
 filebeat setup
 sudo systemctl start filebeat
Check indices:
1
 curl localhost:9200/_cat/indices?v -u elastic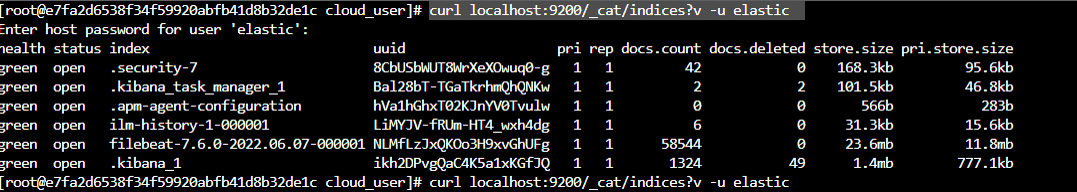
Now do the same thing for other two Nodes in the cluster.
Metricbeat Setup
Install Metricbeat
1
2
3
 curl -O https://artifacts.elastic.co/downloads/beats/metricbeat/metricbeat-7.6.0-x86_64.rpm
 rpm --install metricbeat-7.6.0-x86_64.rpm
 sudo systemctl enable metricbeat
Configure Metricbeat
(Similar to Filebeat, No need to enable modules manually)
1
2
 metricbeat setup
 sudo systemctl start metricbeat
Verify indices:
1
 curl localhost:9200/_cat/indices?v -u elastic
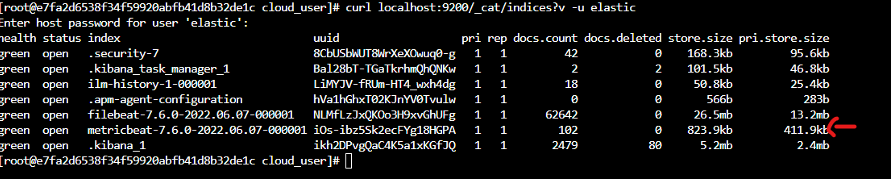
Now do the same thing for other two Nodes in the cluster.
Final Dashboard Access & Analyzing the Logs
- Open your browser
- Access Kibana Dashboard using:
1
http://172.31.115.14:8080/
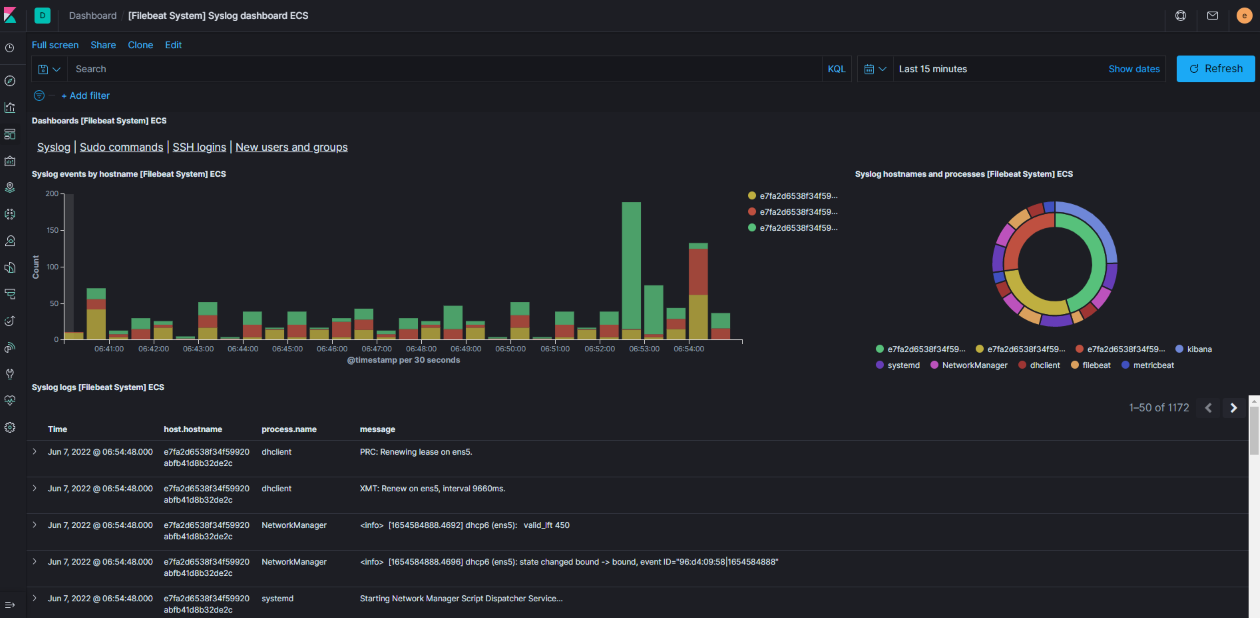
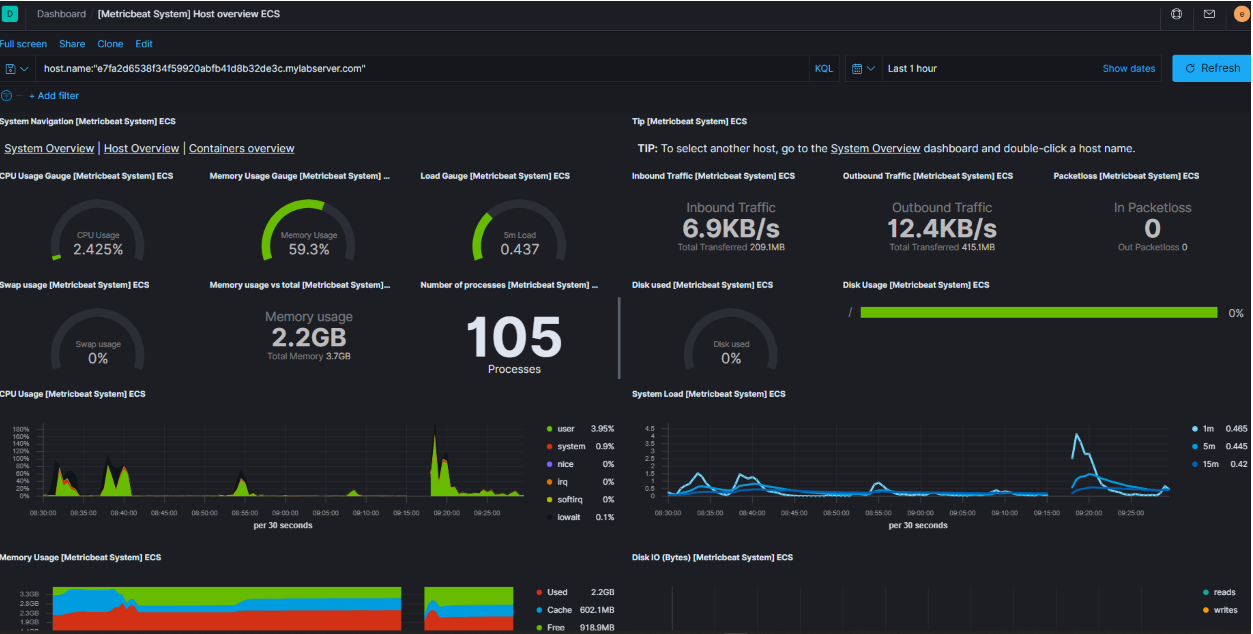
Explore the system metrics and logs collected via Filebeat and Metricbeat!
Dashboard → Filebeat System
Metricbeat System
Thats it! Now you have your own SIEM Solution that allows you to Visualize server metric and logs, Secure your elastic search cluster with SSL and Authentication and Expand easily by adding more nodes. In Next Article I will write about how you can automate this process with a Terraform Script.
STAY TUNE!!
HAPPY HACKING!!